CorityOne // Analytics & Reporting

EHS+ Reporting & Dashboards for Data-Driven Performance

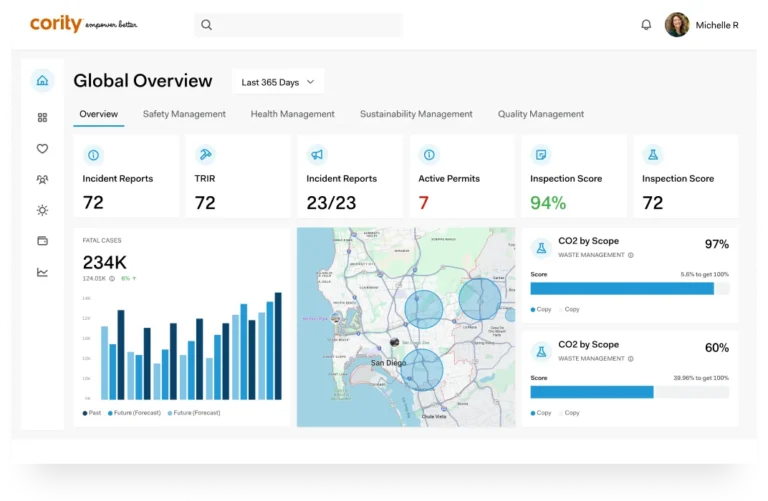
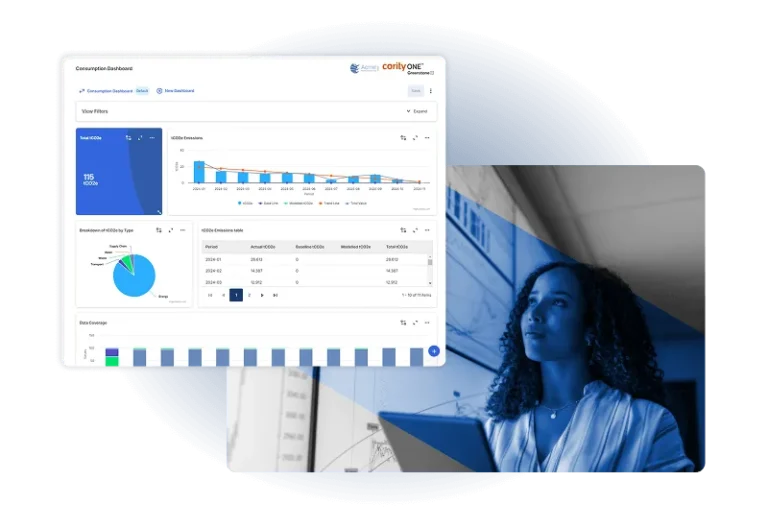
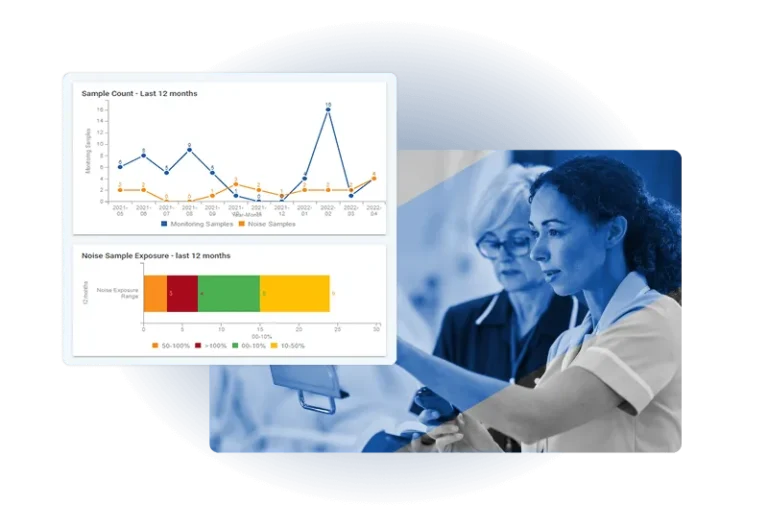
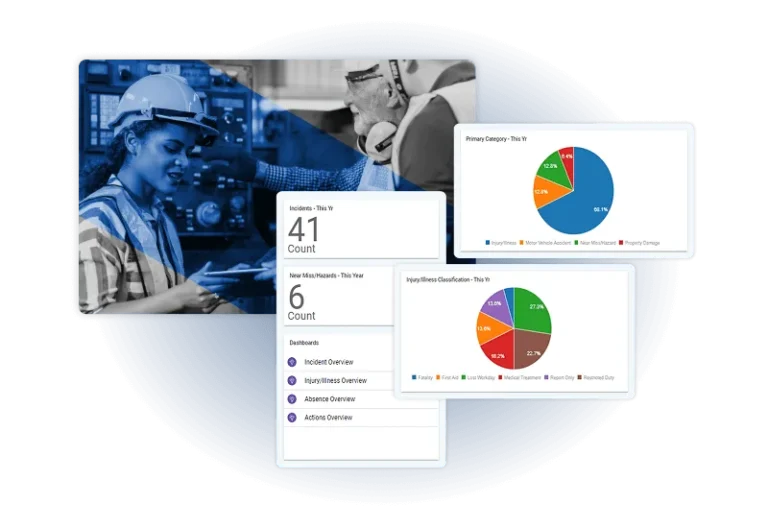
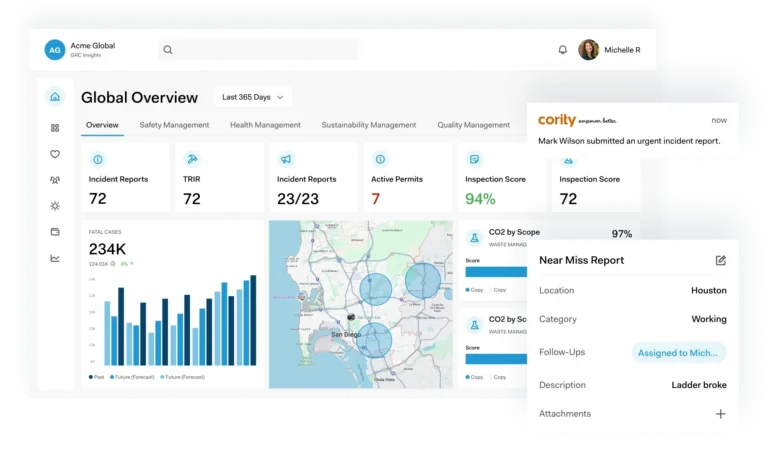
  • Unified Business Intelligence. EHS reporting and dashboards powered by CorAnalytics convert data into clear, visual insights.
  • Contextual Insights. Access real-time alerts and recommendations at the point of decision-making with CorInsights.
  • Audit-Ready Outputs. Flexible reporting tools standardize data, dashboards, and compliance-ready outputs.
Industry UI
Industry UI
Industry UI

Trusted by companies embedding analytics to drive EHS+ impact.

White Shell logo featuring a stylized seashell above the word Shell in bold letters, symbolizing the company’s commitment to EHS Compliance Management on a light background.
A large, stylized U logo made up of various icons and shapes, with "Unilever" in a handwritten-style font below it. The light gray image on white subtly reflects Unilever’s commitment to EHS Compliance Management.
White Carleton University logo with text on the left and a crest featuring a stylized maple leaf and waves on the right, all on a light gray background, highlighting EHS Reporting for enhanced safety management.
White TVA logo and text Tennessee Valley Authority on a light gray background. Large, bold TVA letters appear on the left, with the full name in stacked text to the right—ideal for EHS Reporting & Dashboards materials.
The image shows the Toyota logo, made of three overlapping ovals, next to “TOYOTA” in bold capitals. The simple design uses a light gray color on white, reflecting clarity and reliability like effective management of change software.

EHS+ Reporting & Dashboard Features

CorAnalytics

BI dashboards powered by Qlik Sense deliver predictive insights.

CorInsights

Real-time actionable guidance at the record level.

Sustainability & ESG Reporting

Standardize and audit ESG data across targets, frameworks and reports.

Scalable Data Connections

Enterprise APIs & data flows built for today, ready to grow.

Data Integrity

Maintain data accuracy and consistency across EHS+ systems.

Real-time Information

Access up-to-the-minute EHS & ESG data to guide informed decisions.

EHS+ Integrated Data

Seamlessly connect all data types from internal and third-party sources.

Program Scalability

Scales to track EHS+ data across global enterprise growth.

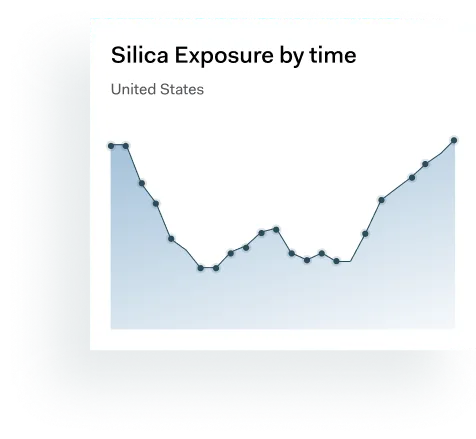
Early Risk Detection

Identify trends and flag emerging risks before they escalate.

AI-Powered Insights

Embedded AI surfaces patterns prioritizes interventions.
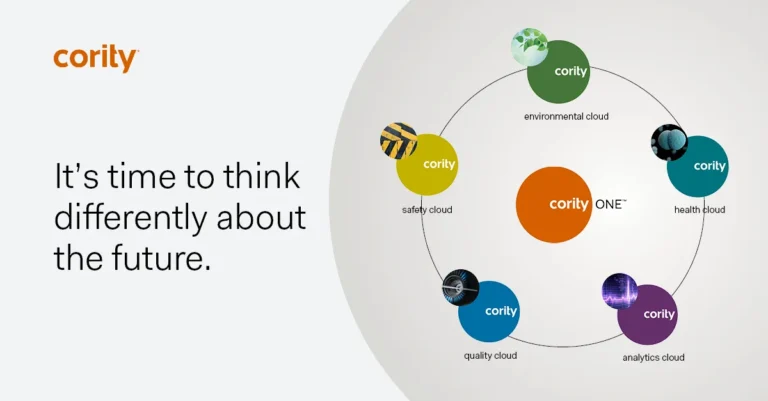
Capterra Icon
Stars Image
4.3

Award‑Winning EHS+ Analytics Platform

Recognized as leader in EHS+ & ESG business intelligence and analytics. Praised for scalability, data integrity, and actionable EHS+ insight delivery.
A digital badge in the Header reads Verdantix Green Quadrant EHS Software Leader 2025, set against abstract blue and teal shapes in the background.
A badge reading verdantix Green Quadrant ESG & Sustainability Reporting Software Leader 2025 with geometric patterns in dark blue and teal at the bottom.
capterra Badge
Circular badge with a green leaf icon at the top, text reads E+E Leader Awards 2025 and Software + Cloud at the bottom, in blue and green letters on a white background with a blue-green border.
A circular red and blue badge reads 2025 Winner OH&S Industrial Hygiene Awards with a star and ribbon design, highlighting achievement in Industrial Ergonomics.

EHS Reporting: From Data to Action

A digital dashboard showing charts and graphs overlays a photo of a woman holding a laptop and looking thoughtfully at a board with diagrams, highlighting Industial Hygiene Software in striking blue tones.

Step 1: Collect & Unify EHS+ Data

Aggregate data from across EHS & ESG programs, front-line users, and external systems securely.

A graph showing sample counts and noise sample exposure over 12 months is overlaid on a blue-tinted photo of two women, one in a lab coat and another in medical scrubs, working together in a lab setting using Industrial Hygiene Software.

Step 2: Analyze & Predict Risk

Use embedded business intelligence to model, trend and proactively act on risk.

A collage showing two engineers in safety gear on the left, with overlaid dashboard panels from Industrial Hygiene Software displaying incident counts and pie charts for injury and incident statistics on the right.

Result: Data‑Driven Performance

Deliver improved EHS compliance, ESG transparency, and operational performance.

Real Stories. Smarter EHS+ Insights.
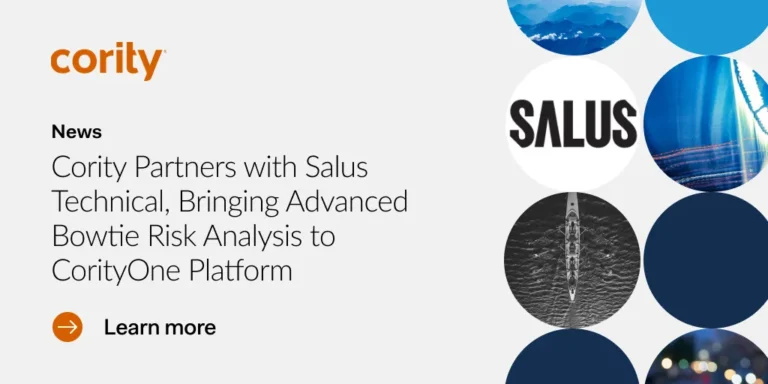
Abstract purple and pink background with text empower better clarity, predictive analytics, and Cority Analytics Cloud logo.

Elevating EHS Performance with Data Analytics

Webinars
A person covers their face with their hands in front of a wall covered in sticky notes with business terms, highlighting the pressures of fostering a strong safety culture.

EHS Buzzwords Explained: Safety Culture

Blog
Abstract purple and pink background with text empower better clarity, predictive analytics, and Cority Analytics Cloud logo.

Using Predictive Analytics to Stop Injuries Before They Happen

Webinars
Webinar promo image: Transforming complex emissions data into actionable insights for sustainable performance, sponsored by Cority and moderated by Katie Ryan, October 7, 2025, 11AM ET. Wind turbines and data graphics in background.

Turning Complex Emissions Data into Actionable Insights for Sustainable Performance

Webinars
Learn the most common examples of health and safety leading indicators

Getting Started with Health and Safety Leading Indicators

Blog
solution-ui-banner

Turn EHS Reporting Into Performance Advantage

Unify EHS reporting and dashboards with predictive CorAnalytics and contextual CorInsights. Anticipate risk, strengthen compliance, and deliver measurable performance. Enhance with embedded AI.